5 Key Differences Between mmWave and sub-6GHz
Introduction
In the 5G race towards offering tens of gigabit/s, the new spectrum portions became essential, especially in mmWave range. In 3GPP Rel-16 of 5G standard [1] the considered spectrum is given in two parts:
| Spectrum part | Frequency range |
| FR1 | 410 MHz – 7125 MHz |
| FR2 | 24250 MHz – 52600 MHz |
FR1 is a typical spectrum band used in current cellular systems starting from first-gen analog AMPS system towards fourth-gen digital LTE-advanced standard. However, 5G is the first system where frequencies higher than 6 GHz are taken into account. The motivation behind new spectrum portions is the mentioned need for offering throughput of gigabit/s and more. This is due to the fact that in mmWave’s band it is possible to allocate bandwidths of a few Gigahertz of spectrum [2].
The game is worth playing since, in the FR2, the Gigahertz spectrum bandwidth can be applied for efficient transmission within a 5G system. But one may pose the question: if the price is so exciting then why nobody used mmWaves previously in cellular systems?
One of the main reason is the changed physical conditions and transmission challenges. The five key factors are given below.
1. Enhanced path loss attenuation of mmWave
Famous Friis formula PR=PTGTGR(λ/4πd)2 describes the received power related to transmitted power, transmit and receive antenna gains GT, GR, signal wavelength λ, and distance d between the transmitter and receiver. Then, if signals of various frequencies are compared, the wavelength in the numerator (which is squared) plays the main role. Therefore, the larger the wavelength, the higher the received power within a given distance. Including λ=c/f into consideration, the higher the frequency f, the lower the received power within a given distance. Let’s compare the Friis’s loss for some most popular frequencies within a distance of 1 km:
| Frequency | Description | Friis’s loss per 1 km distance |
| 900 MHz | Standard cellular network frequency | 91.5 dB |
| 3600 MHz | New allocated 5G NR bandwidth within FR1 spectrum | 103.6 dB |
| 28 GHz | New allocated 5G NR bandwidth within FR2 spectrum – ‘mmWaves’ | 121.4 dB |
same transmitted power, the coverage in the mmWave range is significantly lower than for sub-6 GHz bands.
2. Significant reflection and transmission losses in the mmWave range
The rule of thumb says that the wave is blocked by the obstacles of a similar depth as wavelength. For 6 GHz the wavelength is equal to 5 cm which is the typical minimum wall size. The frequencies below 6 GHz offer good transmission properties (the lower the frequency, the better the transmission). How are mmWaves on this? Much worse. In Fig. 1 one can see the reflected power from various surfaces. The difference between the windowpane and the dressed stone wall is even 20 dB!

3. Diffraction and scattering consideration for mmWave
Differently from sub-6 GHz waves, in mmWave spectrum, the diffraction is said to be significantly less important than in sub-6 GHz. This is due to the higher value of diffraction loss in the diffraction wedge. As it is reported in [3], for 6 meters away from wedge the diffraction loss for 20 GHz signal is 17 decibels greater than for 1 GHz wave. However, the scattering becomes more important since the size of roughness in the scattering plane starts being comparable with signal wavelength.
4. Precipitation and gas attenuation shows up in mmWave spectrum range
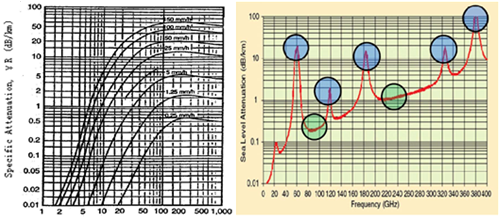
How about losing coverage when a heavy rain comes up? What was for sub-6 GHz unnoticeably visible, now in mmWaves is allowed to speak: the influence of rain/snow and gas attenuation. As it is shown in Fig. 2a the attenuation for standard 50 mm/h rain within 30 GHz is 10 dB per km what becomes quite a serious value, especially when compared to 0.03 dB/km for 3.6 GHz carrier. A brief look into gas attenuation (Fig. 2b) gives more optimism since the attenuation for 28 GHz is 0.05 dB/km what is pretty small. However, if higher frequencies are considered, then, gas attenuation is an important factor to be considered (e.g. 20 dB/km for 60 GHz).

5. Foliage attenuation is significant in mmWave
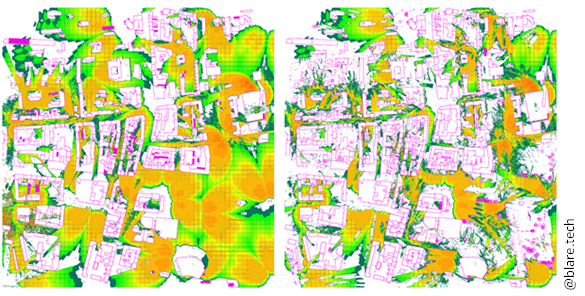
Since the wavelength of mmWave is of the order of millimeters, then the obstacles of a similar size are crucial in propagation. This is applicable also to trees, bushes, woodlands, parks which for lower frequencies were treated as mild scatterers. According to ITU-R P.833-9 [7], the attenuation in woodland can increase from 0.4 dB/m for 2 GHz even to 6 dB/m for 30 GHz! It seems that it is time to change the attitude and start treating foliage as a potential blocker of radio signals. In Fig. 3 one can see the comparison of radio coverage when foliage is not taken into account (left side) and when it is included in the model (right side) (carrier frequency is 28 GHz).

Summary
The conclusion may look gloomy: every of the above five factors simply means additional attenuation in the link. Some of them, smaller, some of them, larger, but still additional attenuation, which simply means worse coverage in the mmWave range.
Fortunately, in this picture there is also some good news: the mmWaves are predicted to operate in urban areas where a great density of users is observed, and indoor (mainly LOS, Line-of-Sight) scenarios are in use. Both cases do not need large distances for transmission. Thus, the antennas of greater gain and smaller size may be used. All in all, detailed network planning is here significantly important.
Note: See my next post on: Three levels of details in mmWaves propagation modeling
References
[1] TS 38.101-2, “User Equipment (UE) radio transmission and reception; Part 2: Range 2 Standalone”, European Telecommunications Standard Institute, 2019.
[2] WRC 2019, “World Radiocommunication Conference 2019 (WRC-19). Final Acts”, Available: http://handle.itu.int/11.1002/pub/813b5921-en
[3] ITU-R P.2040, “Effects of building materials and structures on radiowave propagation above about 100 MHz”, International Telecommunication Union Radiocommunication Sector ITU-R, 2013.
[4] mmMAGIC, (May 2017). Measurement results and final mmMAGIC channel models, H2020-ICT-671650-mmMAGIC/D2.2 v1.0. Available: https://5g-mmmagic.eu/results/
[5]Federal Communications Commission, Office of Engineering and Technology, “Millimeter Wave Propagation: Spectrum Management Implications”, 07.1997
[6] T. S. Rappaport, J. N. Murdock, and F. Gutierrez, Jr., “State of the art in 60-GHz integrated circuits and systems for wireless communications,” Proc. IEEE, vol. 99, no. 8, pp. 1390–1436, Aug. 2011.
[7] ITU-R P 833.9, “Rain height model for prediction methods”, International Telecommunication Union Radiocommunication Sector ITU-R, 2013.
Author Bio
Krzysztof Cichoń did his Ph.D. in 2017. Currently, he is an adjunct assistant professor at the Institute of Radiocommunications at Poznan University of Technology in Poland. He worked with mmWave since 2018. He joined the team of RIMEDO Labs, to serve as a consultant and senior technical trainer.

It’s a good summary